 |
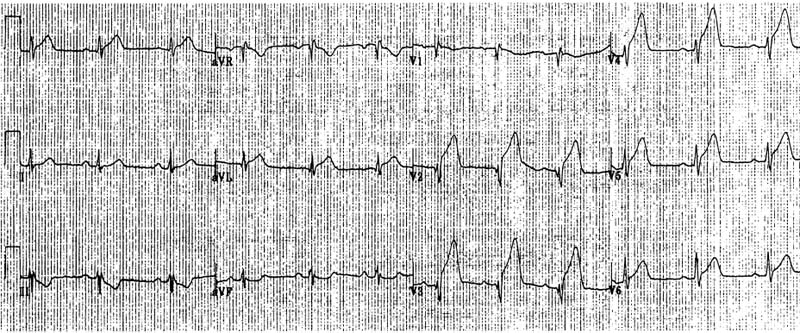
Figure 1 The 12-lead ECG in an anterior wall AMI. There is ST elevation with positive T waves in lead I, aVL V1-6, ST segment depression in III and aVF and qR and qrS pattern in lead V1 and V2,3 respectively. The coronary anatomy showed 100% occlusion of the proximal LAD and normal RCA and LCF. |
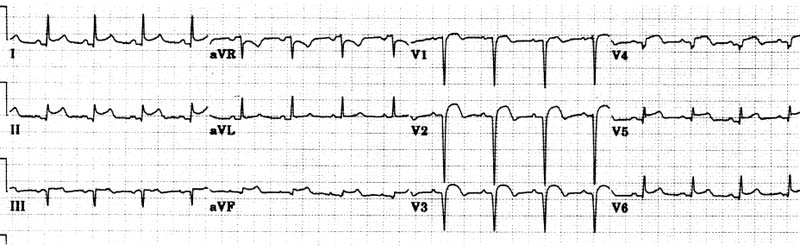 |
Figure 2 The 12 lead ECG in an anterior AMI. There is ST segment elevation in Lead I, II, III, aVF and V1-6. Abnormal Q waves are present in lead V1-V4, III and aVF. The coronary anatomy showed 70% obstruction of the mid LAD and of the posterior descending artery. The LAD “ wrapped” around the apex. The ECG changes in the inferior leads were more likely due to “wrapped” around the apex LAD than to an old IMI secondary to occlusion of the posterior descending artery. |
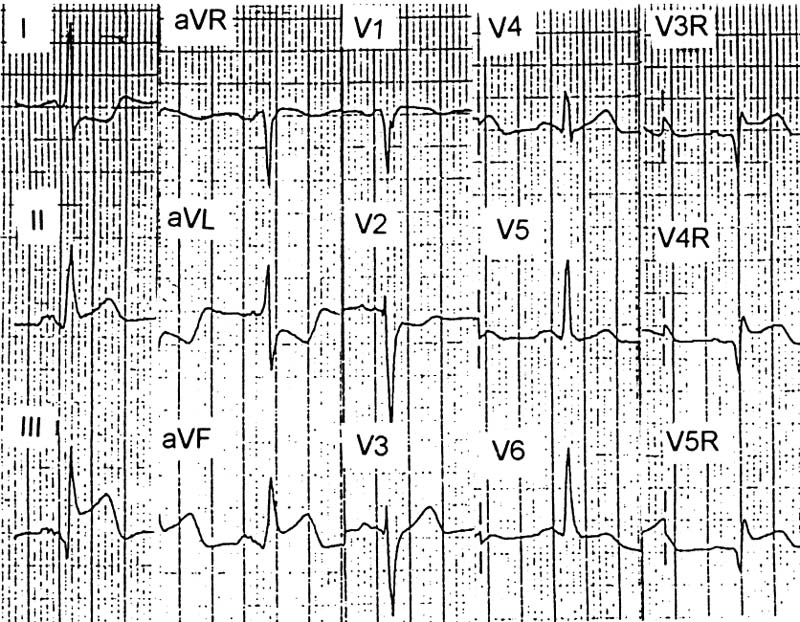 |
Figure 3 The 12-lead ECG in an inferior AMI. There is ST segment elevation in lead II, III, aVF, V3R, V4R, V1 and ST segment depression in lead I, aVL, V2. The ST segment elevation is more prominent in lead III than II. Coronary anatomy revealed 80% obstruction of the proximal RCA and 90% obstruction of the proximal LAD. |
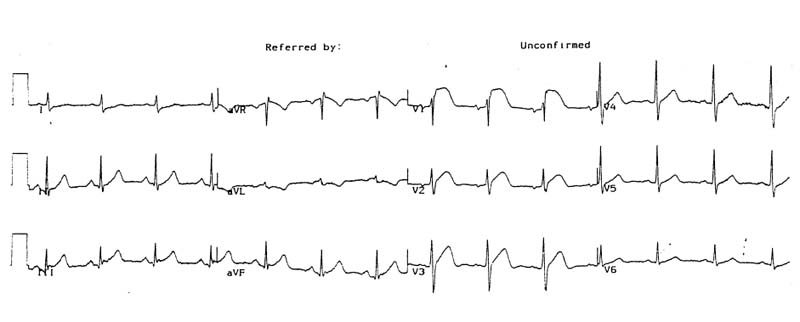 |
Figure 4 The 12 lead ECG in an isolated right ventricular AMI due to occlusion of the first right ventricular branch after stent placement into the proximal and mid RCA. Note prominent ST elevation with positive T waves in lead V1-3. There is also mild ST elevation in III and less in lead aVF. |
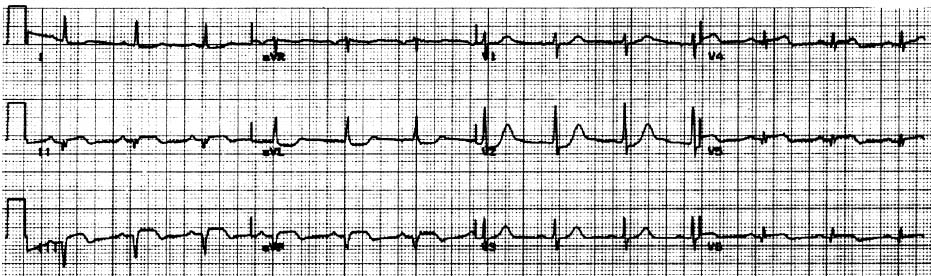 |
Figure 5 The 12-lead ECG in an infero-posterior wall AMI. There is ST segment elevation in lead II, III and V4-6 and depression in lead I, aVL. Additional changes were prominent R wave and ST segment depression with positive T wave in lead V2 and ST elevation in Lead V4-6, which is consistent with LCF occlusion. However, the more prominent ST elevation in lead III than II and ST segment depression in aVL suggests RCA occlusion. Coronary angiography revealed 70% RCA occlusion, 60% LMCA stenosis, 50% mid LAD occlusion with diffuse nonobstructive disease of the LCF. This case illustrates the difficulties in identifying the IRA in patients with multi-vessel disease with or without possible previous myocardial infarction. |
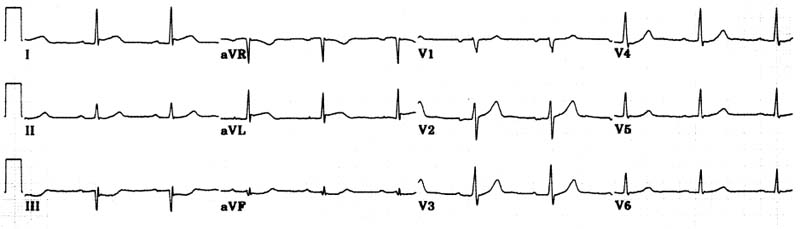 |
Figure 6 The 12-lead ECG of a lateral wall AMI. The ST segment is elevated in lead aVL less and I prominent in lead V2 together with ST segment depression in leads III and aVF. Coronary angiography revealed severe obstruction of the first diagonal branch. Increased CPK and its MB fraction confirmed the diagnosis of an AMI |
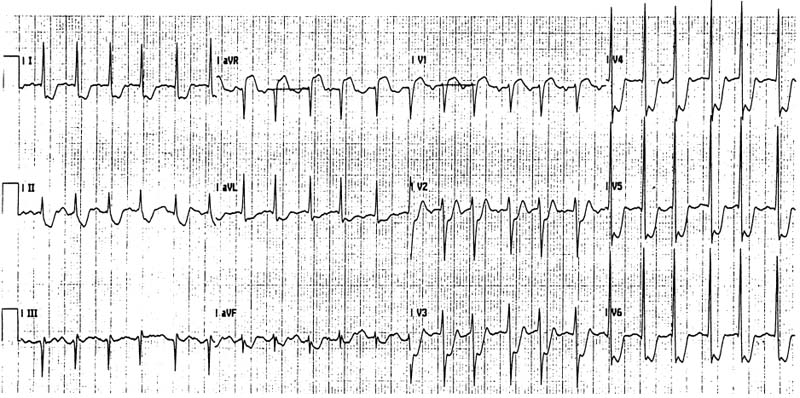 |
Figure 7 The 12-lead ECG in a patient with previous coronary artery grafting and in-stent restenosis of the LMCA. The ST segment elevation in lead aVR is more prominent that in V1 and there is also ST segment depression in all leads except lead III. Coronary angiography revealed subtotal obstruction of the LMCA and 99% LCF ostium stenosis. (This ECG was recorded 2 hours after the onset of chest pain). |
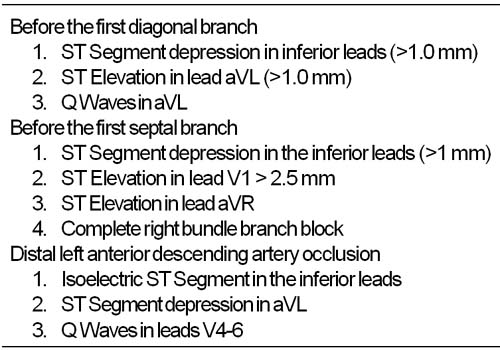 |
Table 1 Left anterior descending artery occlusion |
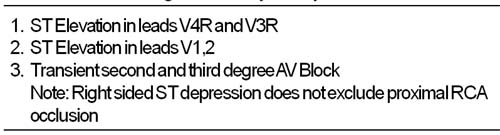 |
Table 2 Proximal right coronary artery occlusion |
| Table 3 Differential diagnosis between right coronary artery and left circumflex coronary artery occlusion |